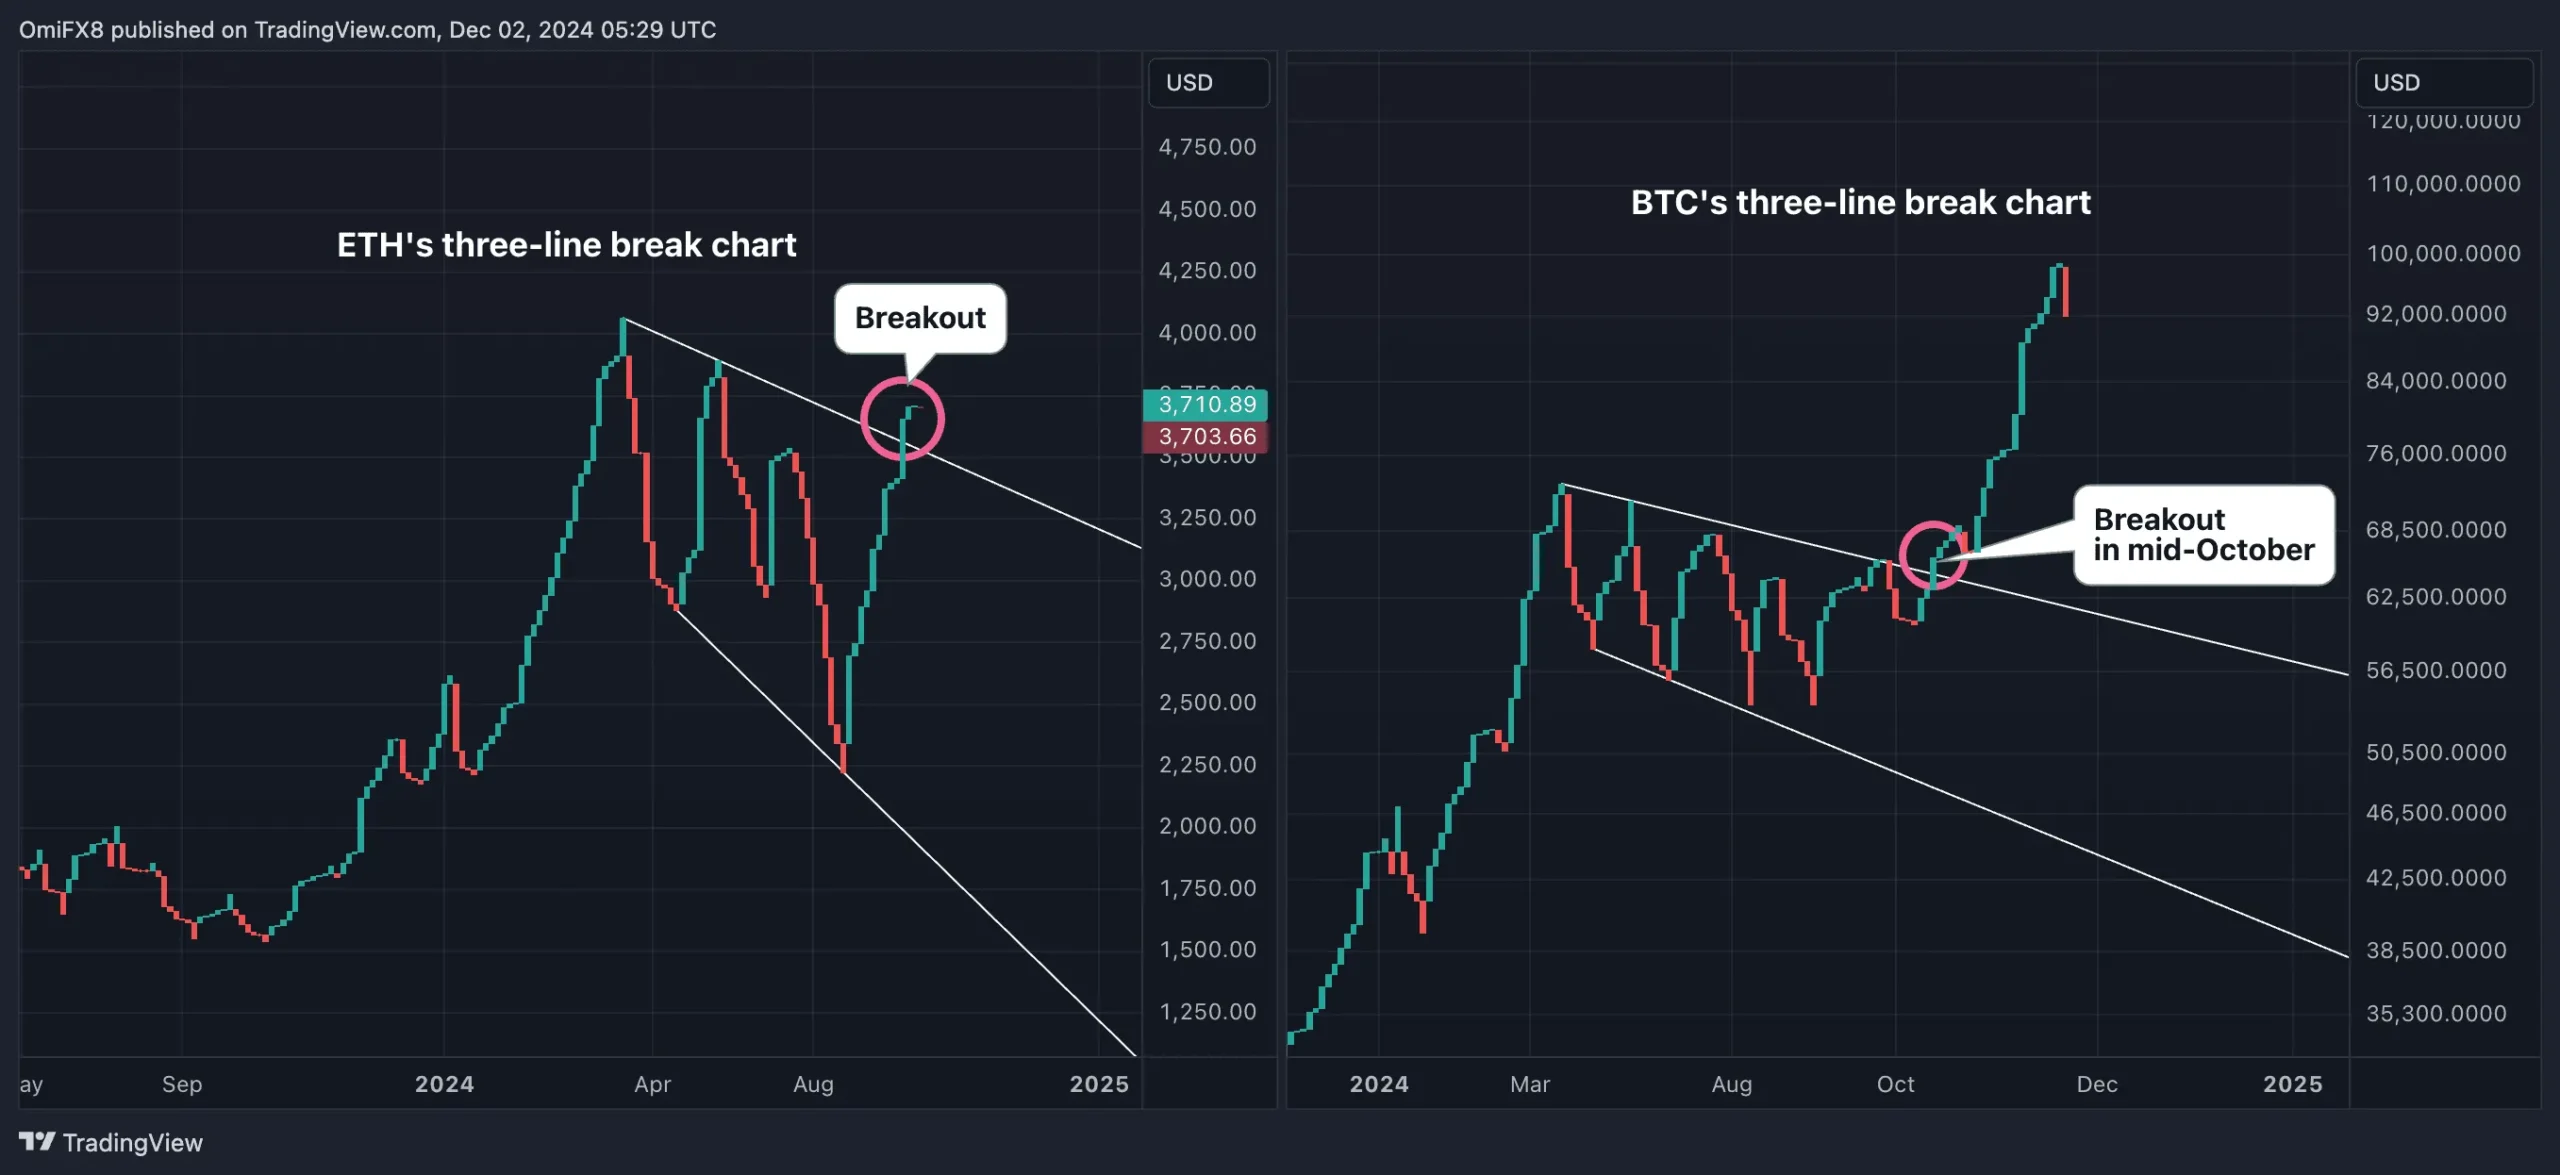
Ethereum’s native token, ether (ETH), is gaining momentum as its price chart displays a pattern reminiscent of Bitcoin’s (BTC) bullish breakout just before its historic rally. Combined with surging network activity and record ETF inflows, ETH may be poised for significant upward movement.
Ether’s Price Chart Signals a Bullish Breakout
Ethereum’s three-line break chart, a tool that eliminates short-term noise, reveals a critical shift in its price movement. For the past eight months, ETH was locked in a corrective trend, marked by lower highs and lower lows. However, the latest chart signals a breakout, marking the end of this downward pattern and the resumption of a broader uptrend from October 2023, when ETH touched $1,500.
- Breakouts of this nature often trigger rallies, as new buyers enter the market and previous sellers are forced to close positions, allowing for further price growth.
- This setup mirrors Bitcoin’s breakout in mid-October, which acted as a catalyst for BTC’s massive climb. Since then, Bitcoin has surged 45%, surpassing $96,000.
Ethereum Fundamentals Align with Bullish Momentum
The bullish technical outlook is being reinforced by growing strength in Ethereum’s fundamentals, particularly within its network and institutional investment.
1. Network Activity on the Rise
The Ethereum network is experiencing heightened activity, particularly in its layer-2 protocols, which posted a significant increase in “blob” submissions in November.
- Posting these blobs—a form of data transaction—requires fees paid in ether (ETH). These fees are subsequently burned, permanently reducing ETH’s circulating supply.
- This supply reduction mechanism strengthens Ethereum’s scarcity, a factor that can contribute to upward price pressure as demand rises.
2. Record Spot ETF Inflows Reflect Investor Confidence
Investor interest in Ethereum is hitting new highs. On Friday, the nine spot Ethereum ETFs listed in the U.S. recorded combined inflows of $332.9 million—the largest single-day total since their launch, according to data from Farside Investors.
- This surge in inflows underscores growing confidence from mainstream investors, particularly institutions, as they increasingly view ETH as a viable long-term asset.
Bitcoin Comparison: Is ETH Poised for a Similar Rally?
Ethereum’s current chart pattern and market activity mirror Bitcoin’s trajectory just before its record-breaking rally in October. BTC’s breakout signaled a shift in market sentiment, fueling its climb to all-time highs.
- Analysts believe Ethereum is now in a comparable position. The bullish breakout on ETH’s chart, coupled with improving fundamentals, suggests ETH could follow a similar upward path.
- With increasing activity on the network and record ETF inflows, Ethereum’s momentum is gaining strength.
Ethereum Positioned for a Major Upswing
Ethereum’s bullish technical breakout, rising network demand, and surging institutional interest via ETFs create a powerful combination for future price gains. The three-line break chart now signals a potential rally, much like Bitcoin experienced before its recent surge.

As ETH mirrors these bullish signals and benefits from supply burns and strong inflows, investors are watching closely for the next phase of Ethereum’s growth. With momentum building, Ethereum may be on the verge of a significant price breakout, offering optimism for long-term holders and traders alike.

